The usual definition is simple, which is most of its appeal. Lines shipped over lines ordered, measured weekly or monthly, reported as a single percentage. Some businesses count cases instead of lines, or units, and a few count order value. The common versions all share the same property: every item in the range gets one vote, and the votes are added up.
That would be fine if a range were flat. Ranges are not flat. In most businesses a small head of items does the large majority of the revenue, and a long tail does very little each. So the count is dominated by the tail and the money is dominated by the head. A metric built on counting lines is therefore mostly a description of the tail, reported as though it described the business.
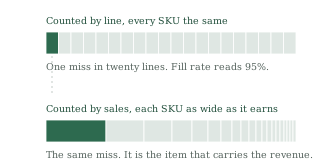
The consequence shows up in where the effort goes. If the headline reads 95% and the target is 95%, the misses that actually hurt are invisible, because they are averaged into a number that has already passed. And when a team is asked to lift the aggregate, the cheapest way to do it is on the tail. Adding a little cover to a lot of slow items moves the count efficiently. It moves the revenue very little, and it consumes working capital in the part of the range where capital earns least. The head stays exposed while the metric improves.
The correction is arithmetic rather than a project. Weight each line by what that item sells, then compute the same ratio. It is one extra column against data the business already has, and it can be done for a single past quarter in an afternoon to see whether the gap is worth caring about. In some ranges the two numbers land close together. In skewed ranges they separate, and the separation is the finding.
Two honest caveats. The weighted number does not reliably move in one direction. If your misses sit in the head it drops, sometimes sharply. If they sit in the tail, which is common because slow and irregular items are the hardest to forecast, it can come out higher than the raw figure. Both outcomes are useful and they mean different things, and you cannot tell which one you have without computing it. And weighting tells you where to look, not what to do. It ranks the misses by what they cost. Deciding which of them to fix, and at what price in stock, is a separate question.
What it does change is the trade against inventory. Cover held on the head is cheap relative to the revenue it protects. Cover held on the tail is expensive relative to what it protects, and it is where excess quietly accumulates. An unweighted fill rate pushes you the wrong way on both at once: it under-rewards protecting the head and over-rewards padding the tail. Weighting it is not a better dashboard. It is the difference between a service level that defends the P&L and one that defends the average.